class: center, middle, inverse, title-slide .title[ # Sentiment Analysis ] .subtitle[ ## EDP 618 Week 8 ] .author[ ### Dr. Abhik Roy ] --- <script> function resizeIframe(obj) { obj.style.height = obj.contentWindow.document.body.scrollHeight + 'px'; } </script> <script src="https://ajax.googleapis.com/ajax/libs/jquery/3.6.0/jquery.min.js"></script> <script type="text/x-mathjax-config"> MathJax.Hub.Register.StartupHook("TeX Jax Ready",function () { MathJax.Hub.Insert(MathJax.InputJax.TeX.Definitions.macros,{ cancel: ["Extension","cancel"], bcancel: ["Extension","cancel"], xcancel: ["Extension","cancel"], cancelto: ["Extension","cancel"] }); }); </script> <style> section { display: flex; display: -webkit-flex; } section { height: 600px; width: 60%; margin: auto; border-radius: 21px; background-color: #212121; } .remark-slide-container { background: #212121; } .hljs-github .hljs { background: transparent; color: #b2dfdb; } .hljs-github .hljs-keyword { color: #64b5f6; } .hljs-github .hljs-literal { color: #64b5f6; } .hljs-github .hljs-number { color: #64b5f6; } .hljs-github .hljs-string { color: #b7b3ef; } .hljs-github .hljs { background: transparent; color: #b2dfdb; } .hljs-github .hljs-keyword { color: #64b5f6; } .hljs-github .hljs-literal { color: #64b5f6; } .hljs-github .hljs-number { color: #64b5f6; } .hljs-github .hljs-string { color: #b7b3ef; } section p { text-align: center; font-size: 30px; background-color: #212121; border-radius: 21px; font-family: Roboto Condensed; font-style: bold; padding: 12px; color: #bff4ee; margin: auto; } #center { text-align: center; } #right { text-align: right; } .center p { margin: 0; position: absolute; top: 50%; left: 50%; -ms-transform: translate(-50%, -50%); transform: translate(-50%, -50%); } .center2 { margin: 0; position: absolute; top: 50%; left: 50%; -ms-transform: translate(-50%, -50%); transform: translate(-50%, -50%); } .tab { display: inline-block; margin-left: 40px; } .obr { display:block; margin-top:-15px; } .container { display: flex; } .container > div { flex: 1; /*grow*/ margin-right: 40px; } td, th, tr, table { border: 0 !important; border-spacing:0 !important; overflow-x: hidden; overflow-y: hidden; background-color: unset !important; color: unset !important; } tbody > td > tr:hover { background-color: unset !important; color: unset !important; } </style> <style type="text/css"> .highlight-last-item > ul > li, .highlight-last-item > ol > li { opacity: 0.5; } .highlight-last-item > ul > li:last-of-type, .highlight-last-item > ol > li:last-of-type { opacity: 1; } </style> <div> <style type="text/css">.xaringan-extra-logo { width: 110px; height: 128px; z-index: 0; background-image: url(/Users/skynet/Documents/WVU/Teaching/GitHub.nosync/edp618/static/img/course_hex.png); background-size: contain; background-repeat: no-repeat; position: absolute; top:1em;right:1em; } </style> <script>(function () { let tries = 0 function addLogo () { if (typeof slideshow === 'undefined') { tries += 1 if (tries < 10) { setTimeout(addLogo, 100) } } else { document.querySelectorAll('.remark-slide-content:not(.title-slide):not(.inverse):not(.hide_logo)') .forEach(function (slide) { const logo = document.createElement('a') logo.classList = 'xaringan-extra-logo' logo.href = 'https://edp618.asocialdatascientist.com' slide.appendChild(logo) }) } } document.addEventListener('DOMContentLoaded', addLogo) })()</script> </div> --- class: highlight-last-item layout: true --- # Getting Prepped -- ## Opening a Script Setting the working directory 1. Open up RStudio -- 2. Go to `File > New File > R Script` -- 3. Go to `File > Save As` and save the R Script in the same folder as the `csv` file. Name it whatever you want (e.g. **Week 7 R Walkthrough**) -- 4. Run the following command in your RStudio console ```r setwd(dirname(rstudioapi::getActiveDocumentContext()$path)) ``` --- ## Loading Packages -- Please load up the following packages by placing these at the top of your script ```r library(tidyverse) library(tidytext) library(textclean) ``` -- You may also want to put ```r setwd(dirname(rstudioapi::getActiveDocumentContext()$path)) ``` below the packages so its there --- ## Getting Data -- We will be working with scripts from the first three seasons of the show [*Rick and Morty*](https://www.rickandmorty.com/). Run the following to load the data ```r rickmorty <- read_csv("RickAndMortyScripts.csv") ``` ``` ## Rows: 1905 Columns: 6 ## ── Column specification ──────────────────────────────────────────────────────── ## Delimiter: "," ## chr (3): episode name, name, line ## dbl (3): index, season no., episode no. ## ## ℹ Use `spec()` to retrieve the full column specification for this data. ## ℹ Specify the column types or set `show_col_types = FALSE` to quiet this message. ``` ```r data("stop_words") ``` --- # Assessing Data -- We can take a look at the first ten rows of the data by running ```r head(rickmorty) ``` ``` ## # A tibble: 6 × 6 ## index `season no.` `episode no.` `episode name` name line ## <dbl> <dbl> <dbl> <chr> <chr> <chr> ## 1 0 1 1 Pilot Rick Morty! You gotta come o… ## 2 1 1 1 Pilot Morty What, Rick? What’s goin… ## 3 2 1 1 Pilot Rick I got a surprise for yo… ## 4 3 1 1 Pilot Morty It's the middle of the … ## 5 4 1 1 Pilot Rick Come on, I got a surpri… ## 6 5 1 1 Pilot Morty Ow! Ow! You're tugging … ``` --- We can also take a look at the types of columns by running ```r glimpse(rickmorty) ``` ``` ## Rows: 1,905 ## Columns: 6 ## $ index <dbl> 0, 1, 2, 3, 4, 5, 6, 7, 8, 9, 10, 11, 12, 13, 14, 15, 1… ## $ `season no.` <dbl> 1, 1, 1, 1, 1, 1, 1, 1, 1, 1, 1, 1, 1, 1, 1, 1, 1, 1, 1… ## $ `episode no.` <dbl> 1, 1, 1, 1, 1, 1, 1, 1, 1, 1, 1, 1, 1, 1, 1, 1, 1, 1, 1… ## $ `episode name` <chr> "Pilot", "Pilot", "Pilot", "Pilot", "Pilot", "Pilot", "… ## $ name <chr> "Rick", "Morty", "Rick", "Morty", "Rick", "Morty", "Ric… ## $ line <chr> "Morty! You gotta come on. Jus'... you gotta come with … ``` --- # Wrangling Terms --- ## Selecting Needed Columns -- ```r rickmorty_selected <- rickmorty %>% select(index, line) rickmorty_selected ``` ``` ## # A tibble: 1,905 × 2 ## index line ## <dbl> <chr> ## 1 0 Morty! You gotta come on. Jus'... you gotta come with me. ## 2 1 What, Rick? What’s going on? ## 3 2 I got a surprise for you, Morty. ## 4 3 It's the middle of the night. What are you talking about? ## 5 4 Come on, I got a surprise for you. Come on, hurry up. ## 6 5 Ow! Ow! You're tugging me too hard! ## 7 6 We gotta go, gotta get outta here, come on. Got a surprise for you Mor… ## 8 7 What do you think of this... flying vehicle, Morty? I built it outta s… ## 9 8 Yeah, Rick... I-it's great. Is this the surprise? ## 10 9 Morty. I had to... I had to do it. I had— I had to— I had to make a bo… ## # … with 1,895 more rows ``` --- ## Getting Rid of Common Terms ```r tidy_script <- rickmorty_selected %>% unnest_tokens(word, line) %>% anti_join(stop_words) ``` ``` ## Joining, by = "word" ``` ```r tidy_script ``` ``` ## # A tibble: 8,513 × 2 ## index word ## <dbl> <chr> ## 1 0 morty ## 2 0 gotta ## 3 0 jus ## 4 0 gotta ## 5 1 rick ## 6 1 what’s ## 7 2 surprise ## 8 2 morty ## 9 3 middle ## 10 3 night ## # … with 8,503 more rows ``` --- ## Counting (Remaining) Terms --- count: false .panel1-sw1-auto[ ```r *tidy_script ``` ] .panel2-sw1-auto[ ``` ## # A tibble: 8,513 × 2 ## index word ## <dbl> <chr> ## 1 0 morty ## 2 0 gotta ## 3 0 jus ## 4 0 gotta ## 5 1 rick ## 6 1 what’s ## 7 2 surprise ## 8 2 morty ## 9 3 middle ## 10 3 night ## # … with 8,503 more rows ``` ] --- count: false .panel1-sw1-auto[ ```r tidy_script %>% * count(word, sort = TRUE) ``` ] .panel2-sw1-auto[ ``` ## # A tibble: 3,072 × 2 ## word n ## <chr> <int> ## 1 morty 334 ## 2 rick 169 ## 3 gonna 113 ## 4 time 89 ## 5 yeah 78 ## 6 uh 53 ## 7 whoa 53 ## 8 jerry 50 ## 9 god 48 ## 10 guys 48 ## # … with 3,062 more rows ``` ] <style> .panel1-sw1-auto { color: white; width: 58.8%; hight: 32%; float: top; padding-left: 1%; font-size: 80% } .panel2-sw1-auto { color: white; width: 39.2%; hight: 32%; float: top; padding-left: 1%; font-size: 80% } .panel3-sw1-auto { color: white; width: NA%; hight: 33%; float: top; padding-left: 1%; font-size: 80% } </style> --- ## Plotting Term Counts --- count: false .panel1-sw2-auto[ ```r *tidy_script ``` ] .panel2-sw2-auto[ ``` ## # A tibble: 8,513 × 2 ## index word ## <dbl> <chr> ## 1 0 morty ## 2 0 gotta ## 3 0 jus ## 4 0 gotta ## 5 1 rick ## 6 1 what’s ## 7 2 surprise ## 8 2 morty ## 9 3 middle ## 10 3 night ## # … with 8,503 more rows ``` ] --- count: false .panel1-sw2-auto[ ```r tidy_script %>% * count(word, sort = TRUE) ``` ] .panel2-sw2-auto[ ``` ## # A tibble: 3,072 × 2 ## word n ## <chr> <int> ## 1 morty 334 ## 2 rick 169 ## 3 gonna 113 ## 4 time 89 ## 5 yeah 78 ## 6 uh 53 ## 7 whoa 53 ## 8 jerry 50 ## 9 god 48 ## 10 guys 48 ## # … with 3,062 more rows ``` ] --- count: false .panel1-sw2-auto[ ```r tidy_script %>% count(word, sort = TRUE) %>% * mutate(word = reorder(word, n)) ``` ] .panel2-sw2-auto[ ``` ## # A tibble: 3,072 × 2 ## word n ## <fct> <int> ## 1 morty 334 ## 2 rick 169 ## 3 gonna 113 ## 4 time 89 ## 5 yeah 78 ## 6 uh 53 ## 7 whoa 53 ## 8 jerry 50 ## 9 god 48 ## 10 guys 48 ## # … with 3,062 more rows ``` ] --- count: false .panel1-sw2-auto[ ```r tidy_script %>% count(word, sort = TRUE) %>% mutate(word = reorder(word, n)) %>% * ggplot(aes(n, word)) ``` ] .panel2-sw2-auto[ <!-- --> ] --- count: false .panel1-sw2-auto[ ```r tidy_script %>% count(word, sort = TRUE) %>% mutate(word = reorder(word, n)) %>% ggplot(aes(n, word)) + * geom_col() ``` ] .panel2-sw2-auto[ <!-- --> ] --- count: false .panel1-sw2-auto[ ```r tidy_script %>% count(word, sort = TRUE) %>% mutate(word = reorder(word, n)) %>% ggplot(aes(n, word)) + geom_col() + * labs(y = NULL) ``` ] .panel2-sw2-auto[ <!-- --> ] --- count: false .panel1-sw2-auto[ ```r tidy_script %>% count(word, sort = TRUE) %>% mutate(word = reorder(word, n)) %>% ggplot(aes(n, word)) + geom_col() + labs(y = NULL) + * theme_minimal() ``` ] .panel2-sw2-auto[ <!-- --> ] <style> .panel1-sw2-auto { color: white; width: 58.8%; hight: 32%; float: left; padding-left: 1%; font-size: 80% } .panel2-sw2-auto { color: white; width: 39.2%; hight: 32%; float: left; padding-left: 1%; font-size: 80% } .panel3-sw2-auto { color: white; width: NA%; hight: 33%; float: left; padding-left: 1%; font-size: 80% } </style> --- count: false .panel1-sw3-auto[ ```r *tidy_script ``` ] .panel2-sw3-auto[ ``` ## # A tibble: 8,513 × 2 ## index word ## <dbl> <chr> ## 1 0 morty ## 2 0 gotta ## 3 0 jus ## 4 0 gotta ## 5 1 rick ## 6 1 what’s ## 7 2 surprise ## 8 2 morty ## 9 3 middle ## 10 3 night ## # … with 8,503 more rows ``` ] --- count: false .panel1-sw3-auto[ ```r tidy_script %>% * count(word, sort = TRUE) ``` ] .panel2-sw3-auto[ ``` ## # A tibble: 3,072 × 2 ## word n ## <chr> <int> ## 1 morty 334 ## 2 rick 169 ## 3 gonna 113 ## 4 time 89 ## 5 yeah 78 ## 6 uh 53 ## 7 whoa 53 ## 8 jerry 50 ## 9 god 48 ## 10 guys 48 ## # … with 3,062 more rows ``` ] --- count: false .panel1-sw3-auto[ ```r tidy_script %>% count(word, sort = TRUE) %>% * filter(n > 2) ``` ] .panel2-sw3-auto[ ``` ## # A tibble: 687 × 2 ## word n ## <chr> <int> ## 1 morty 334 ## 2 rick 169 ## 3 gonna 113 ## 4 time 89 ## 5 yeah 78 ## 6 uh 53 ## 7 whoa 53 ## 8 jerry 50 ## 9 god 48 ## 10 guys 48 ## # … with 677 more rows ``` ] --- count: false .panel1-sw3-auto[ ```r tidy_script %>% count(word, sort = TRUE) %>% filter(n > 2) %>% * mutate(word = reorder(word, n)) ``` ] .panel2-sw3-auto[ ``` ## # A tibble: 687 × 2 ## word n ## <fct> <int> ## 1 morty 334 ## 2 rick 169 ## 3 gonna 113 ## 4 time 89 ## 5 yeah 78 ## 6 uh 53 ## 7 whoa 53 ## 8 jerry 50 ## 9 god 48 ## 10 guys 48 ## # … with 677 more rows ``` ] --- count: false .panel1-sw3-auto[ ```r tidy_script %>% count(word, sort = TRUE) %>% filter(n > 2) %>% mutate(word = reorder(word, n)) %>% * ggplot(aes(n, word)) ``` ] .panel2-sw3-auto[ <!-- --> ] --- count: false .panel1-sw3-auto[ ```r tidy_script %>% count(word, sort = TRUE) %>% filter(n > 2) %>% mutate(word = reorder(word, n)) %>% ggplot(aes(n, word)) + * geom_col() ``` ] .panel2-sw3-auto[ <!-- --> ] --- count: false .panel1-sw3-auto[ ```r tidy_script %>% count(word, sort = TRUE) %>% filter(n > 2) %>% mutate(word = reorder(word, n)) %>% ggplot(aes(n, word)) + geom_col() + * labs(y = NULL) ``` ] .panel2-sw3-auto[ <!-- --> ] --- count: false .panel1-sw3-auto[ ```r tidy_script %>% count(word, sort = TRUE) %>% filter(n > 2) %>% mutate(word = reorder(word, n)) %>% ggplot(aes(n, word)) + geom_col() + labs(y = NULL) + * theme_minimal() ``` ] .panel2-sw3-auto[ <!-- --> ] <style> .panel1-sw3-auto { color: white; width: 58.8%; hight: 32%; float: left; padding-left: 1%; font-size: 80% } .panel2-sw3-auto { color: white; width: 39.2%; hight: 32%; float: left; padding-left: 1%; font-size: 80% } .panel3-sw3-auto { color: white; width: NA%; hight: 33%; float: left; padding-left: 1%; font-size: 80% } </style> --- count: false .panel1-sw4-auto[ ```r *tidy_script ``` ] .panel2-sw4-auto[ ``` ## # A tibble: 8,513 × 2 ## index word ## <dbl> <chr> ## 1 0 morty ## 2 0 gotta ## 3 0 jus ## 4 0 gotta ## 5 1 rick ## 6 1 what’s ## 7 2 surprise ## 8 2 morty ## 9 3 middle ## 10 3 night ## # … with 8,503 more rows ``` ] --- count: false .panel1-sw4-auto[ ```r tidy_script %>% * count(word, sort = TRUE) ``` ] .panel2-sw4-auto[ ``` ## # A tibble: 3,072 × 2 ## word n ## <chr> <int> ## 1 morty 334 ## 2 rick 169 ## 3 gonna 113 ## 4 time 89 ## 5 yeah 78 ## 6 uh 53 ## 7 whoa 53 ## 8 jerry 50 ## 9 god 48 ## 10 guys 48 ## # … with 3,062 more rows ``` ] --- count: false .panel1-sw4-auto[ ```r tidy_script %>% count(word, sort = TRUE) %>% * filter(n > 10) ``` ] .panel2-sw4-auto[ ``` ## # A tibble: 126 × 2 ## word n ## <chr> <int> ## 1 morty 334 ## 2 rick 169 ## 3 gonna 113 ## 4 time 89 ## 5 yeah 78 ## 6 uh 53 ## 7 whoa 53 ## 8 jerry 50 ## 9 god 48 ## 10 guys 48 ## # … with 116 more rows ``` ] --- count: false .panel1-sw4-auto[ ```r tidy_script %>% count(word, sort = TRUE) %>% filter(n > 10) %>% * mutate(word = reorder(word, n)) ``` ] .panel2-sw4-auto[ ``` ## # A tibble: 126 × 2 ## word n ## <fct> <int> ## 1 morty 334 ## 2 rick 169 ## 3 gonna 113 ## 4 time 89 ## 5 yeah 78 ## 6 uh 53 ## 7 whoa 53 ## 8 jerry 50 ## 9 god 48 ## 10 guys 48 ## # … with 116 more rows ``` ] --- count: false .panel1-sw4-auto[ ```r tidy_script %>% count(word, sort = TRUE) %>% filter(n > 10) %>% mutate(word = reorder(word, n)) %>% * ggplot(aes(n, word)) ``` ] .panel2-sw4-auto[ <!-- --> ] --- count: false .panel1-sw4-auto[ ```r tidy_script %>% count(word, sort = TRUE) %>% filter(n > 10) %>% mutate(word = reorder(word, n)) %>% ggplot(aes(n, word)) + * geom_col() ``` ] .panel2-sw4-auto[ <!-- --> ] --- count: false .panel1-sw4-auto[ ```r tidy_script %>% count(word, sort = TRUE) %>% filter(n > 10) %>% mutate(word = reorder(word, n)) %>% ggplot(aes(n, word)) + geom_col() + * labs(y = NULL) ``` ] .panel2-sw4-auto[ <!-- --> ] --- count: false .panel1-sw4-auto[ ```r tidy_script %>% count(word, sort = TRUE) %>% filter(n > 10) %>% mutate(word = reorder(word, n)) %>% ggplot(aes(n, word)) + geom_col() + labs(y = NULL) + * theme_minimal() ``` ] .panel2-sw4-auto[ <!-- --> ] <style> .panel1-sw4-auto { color: white; width: 58.8%; hight: 32%; float: left; padding-left: 1%; font-size: 80% } .panel2-sw4-auto { color: white; width: 39.2%; hight: 32%; float: left; padding-left: 1%; font-size: 80% } .panel3-sw4-auto { color: white; width: NA%; hight: 33%; float: left; padding-left: 1%; font-size: 80% } </style> --- count: false .panel1-sw5-auto[ ```r *tidy_script ``` ] .panel2-sw5-auto[ ``` ## # A tibble: 8,513 × 2 ## index word ## <dbl> <chr> ## 1 0 morty ## 2 0 gotta ## 3 0 jus ## 4 0 gotta ## 5 1 rick ## 6 1 what’s ## 7 2 surprise ## 8 2 morty ## 9 3 middle ## 10 3 night ## # … with 8,503 more rows ``` ] --- count: false .panel1-sw5-auto[ ```r tidy_script %>% * count(word, sort = TRUE) ``` ] .panel2-sw5-auto[ ``` ## # A tibble: 3,072 × 2 ## word n ## <chr> <int> ## 1 morty 334 ## 2 rick 169 ## 3 gonna 113 ## 4 time 89 ## 5 yeah 78 ## 6 uh 53 ## 7 whoa 53 ## 8 jerry 50 ## 9 god 48 ## 10 guys 48 ## # … with 3,062 more rows ``` ] --- count: false .panel1-sw5-auto[ ```r tidy_script %>% count(word, sort = TRUE) %>% * filter(n > 20) ``` ] .panel2-sw5-auto[ ``` ## # A tibble: 37 × 2 ## word n ## <chr> <int> ## 1 morty 334 ## 2 rick 169 ## 3 gonna 113 ## 4 time 89 ## 5 yeah 78 ## 6 uh 53 ## 7 whoa 53 ## 8 jerry 50 ## 9 god 48 ## 10 guys 48 ## # … with 27 more rows ``` ] --- count: false .panel1-sw5-auto[ ```r tidy_script %>% count(word, sort = TRUE) %>% filter(n > 20) %>% * mutate(word = reorder(word, n)) ``` ] .panel2-sw5-auto[ ``` ## # A tibble: 37 × 2 ## word n ## <fct> <int> ## 1 morty 334 ## 2 rick 169 ## 3 gonna 113 ## 4 time 89 ## 5 yeah 78 ## 6 uh 53 ## 7 whoa 53 ## 8 jerry 50 ## 9 god 48 ## 10 guys 48 ## # … with 27 more rows ``` ] --- count: false .panel1-sw5-auto[ ```r tidy_script %>% count(word, sort = TRUE) %>% filter(n > 20) %>% mutate(word = reorder(word, n)) %>% * ggplot(aes(n, word)) ``` ] .panel2-sw5-auto[ <!-- --> ] --- count: false .panel1-sw5-auto[ ```r tidy_script %>% count(word, sort = TRUE) %>% filter(n > 20) %>% mutate(word = reorder(word, n)) %>% ggplot(aes(n, word)) + * geom_col() ``` ] .panel2-sw5-auto[ <!-- --> ] --- count: false .panel1-sw5-auto[ ```r tidy_script %>% count(word, sort = TRUE) %>% filter(n > 20) %>% mutate(word = reorder(word, n)) %>% ggplot(aes(n, word)) + geom_col() + * labs(y = NULL) ``` ] .panel2-sw5-auto[ <!-- --> ] --- count: false .panel1-sw5-auto[ ```r tidy_script %>% count(word, sort = TRUE) %>% filter(n > 20) %>% mutate(word = reorder(word, n)) %>% ggplot(aes(n, word)) + geom_col() + labs(y = NULL) + * theme_minimal() ``` ] .panel2-sw5-auto[ <!-- --> ] <style> .panel1-sw5-auto { color: white; width: 58.8%; hight: 32%; float: left; padding-left: 1%; font-size: 80% } .panel2-sw5-auto { color: white; width: 39.2%; hight: 32%; float: left; padding-left: 1%; font-size: 80% } .panel3-sw5-auto { color: white; width: NA%; hight: 33%; float: left; padding-left: 1%; font-size: 80% } </style> --- ## Getting Rid of Unwanted Terms Manually --- count: false .panel1-sw6-auto[ ```r * rickmorty_selected ``` ] .panel2-sw6-auto[ ``` ## # A tibble: 1,905 × 2 ## index line ## <dbl> <chr> ## 1 0 Morty! You gotta come on. Jus'... you gotta come with me. ## 2 1 What, Rick? What’s going on? ## 3 2 I got a surprise for you, Morty. ## 4 3 It's the middle of the night. What are you talking about? ## 5 4 Come on, I got a surprise for you. Come on, hurry up. ## 6 5 Ow! Ow! You're tugging me too hard! ## 7 6 We gotta go, gotta get outta here, come on. Got a surprise for you Mor… ## 8 7 What do you think of this... flying vehicle, Morty? I built it outta s… ## 9 8 Yeah, Rick... I-it's great. Is this the surprise? ## 10 9 Morty. I had to... I had to do it. I had— I had to— I had to make a bo… ## # … with 1,895 more rows ``` ] --- count: false .panel1-sw6-auto[ ```r rickmorty_selected %>% * mutate(line = str_remove_all(line, "Rick")) ``` ] .panel2-sw6-auto[ ``` ## # A tibble: 1,905 × 2 ## index line ## <dbl> <chr> ## 1 0 Morty! You gotta come on. Jus'... you gotta come with me. ## 2 1 What, ? What’s going on? ## 3 2 I got a surprise for you, Morty. ## 4 3 It's the middle of the night. What are you talking about? ## 5 4 Come on, I got a surprise for you. Come on, hurry up. ## 6 5 Ow! Ow! You're tugging me too hard! ## 7 6 We gotta go, gotta get outta here, come on. Got a surprise for you Mor… ## 8 7 What do you think of this... flying vehicle, Morty? I built it outta s… ## 9 8 Yeah, ... I-it's great. Is this the surprise? ## 10 9 Morty. I had to... I had to do it. I had— I had to— I had to make a bo… ## # … with 1,895 more rows ``` ] --- count: false .panel1-sw6-auto[ ```r rickmorty_selected %>% mutate(line = str_remove_all(line, "Rick")) %>% * mutate(line = str_remove_all(line, "Morty")) ``` ] .panel2-sw6-auto[ ``` ## # A tibble: 1,905 × 2 ## index line ## <dbl> <chr> ## 1 0 ! You gotta come on. Jus'... you gotta come with me. ## 2 1 What, ? What’s going on? ## 3 2 I got a surprise for you, . ## 4 3 It's the middle of the night. What are you talking about? ## 5 4 Come on, I got a surprise for you. Come on, hurry up. ## 6 5 Ow! Ow! You're tugging me too hard! ## 7 6 We gotta go, gotta get outta here, come on. Got a surprise for you . ## 8 7 What do you think of this... flying vehicle, ? I built it outta stuff … ## 9 8 Yeah, ... I-it's great. Is this the surprise? ## 10 9 . I had to... I had to do it. I had— I had to— I had to make a bomb, .… ## # … with 1,895 more rows ``` ] --- count: false .panel1-sw6-auto[ ```r rickmorty_selected %>% mutate(line = str_remove_all(line, "Rick")) %>% mutate(line = str_remove_all(line, "Morty")) %>% * mutate(line = replace_contraction(line)) ``` ] .panel2-sw6-auto[ ``` ## # A tibble: 1,905 × 2 ## index line ## <dbl> <chr> ## 1 0 ! You gotta come on. Jus'... you gotta come with me. ## 2 1 What, ? What’s going on? ## 3 2 I got a surprise for you, . ## 4 3 it is the middle of the night. What are you talking about? ## 5 4 Come on, I got a surprise for you. Come on, hurry up. ## 6 5 Ow! Ow! you are tugging me too hard! ## 7 6 We gotta go, gotta get outta here, come on. Got a surprise for you . ## 8 7 What do you think of this... flying vehicle, ? I built it outta stuff … ## 9 8 Yeah, ... I-it is great. Is this the surprise? ## 10 9 . I had to... I had to do it. I had— I had to— I had to make a bomb, .… ## # … with 1,895 more rows ``` ] --- count: false .panel1-sw6-auto[ ```r rickmorty_selected %>% mutate(line = str_remove_all(line, "Rick")) %>% mutate(line = str_remove_all(line, "Morty")) %>% mutate(line = replace_contraction(line)) %>% * unnest_tokens(word, line) ``` ] .panel2-sw6-auto[ ``` ## # A tibble: 26,070 × 2 ## index word ## <dbl> <chr> ## 1 0 you ## 2 0 gotta ## 3 0 come ## 4 0 on ## 5 0 jus ## 6 0 you ## 7 0 gotta ## 8 0 come ## 9 0 with ## 10 0 me ## # … with 26,060 more rows ``` ] --- count: false .panel1-sw6-auto[ ```r rickmorty_selected %>% mutate(line = str_remove_all(line, "Rick")) %>% mutate(line = str_remove_all(line, "Morty")) %>% mutate(line = replace_contraction(line)) %>% unnest_tokens(word, line) %>% * anti_join(stop_words) ``` ] .panel2-sw6-auto[ ``` ## Joining, by = "word" ``` ``` ## # A tibble: 7,950 × 2 ## index word ## <dbl> <chr> ## 1 0 gotta ## 2 0 jus ## 3 0 gotta ## 4 1 what’s ## 5 2 surprise ## 6 3 middle ## 7 3 night ## 8 3 talking ## 9 4 surprise ## 10 4 hurry ## # … with 7,940 more rows ``` ] --- count: false .panel1-sw6-auto[ ```r rickmorty_selected %>% mutate(line = str_remove_all(line, "Rick")) %>% mutate(line = str_remove_all(line, "Morty")) %>% mutate(line = replace_contraction(line)) %>% unnest_tokens(word, line) %>% anti_join(stop_words) %>% * count(word, sort = TRUE) ``` ] .panel2-sw6-auto[ ``` ## Joining, by = "word" ``` ``` ## # A tibble: 3,056 × 2 ## word n ## <chr> <int> ## 1 gonna 113 ## 2 time 89 ## 3 yeah 78 ## 4 uh 53 ## 5 whoa 53 ## 6 jerry 50 ## 7 god 48 ## 8 guys 48 ## 9 summer 45 ## 10 hey 44 ## # … with 3,046 more rows ``` ] <style> .panel1-sw6-auto { color: white; width: 58.8%; hight: 32%; float: left; padding-left: 1%; font-size: 80% } .panel2-sw6-auto { color: white; width: 39.2%; hight: 32%; float: left; padding-left: 1%; font-size: 80% } .panel3-sw6-auto { color: white; width: NA%; hight: 33%; float: left; padding-left: 1%; font-size: 80% } </style> --- ```r rickandmorty_filtered <- rickmorty_selected %>% mutate(line = str_remove_all(line, "Rick")) %>% mutate(line = str_remove_all(line, "Morty")) %>% mutate(line = replace_contraction(line)) %>% unnest_tokens(word, line) %>% anti_join(stop_words) %>% count(word, sort = TRUE) ``` ``` ## Joining, by = "word" ``` --- count: false .panel1-sw7-auto[ ```r *rickandmorty_filtered ``` ] .panel2-sw7-auto[ ``` ## # A tibble: 3,056 × 2 ## word n ## <chr> <int> ## 1 gonna 113 ## 2 time 89 ## 3 yeah 78 ## 4 uh 53 ## 5 whoa 53 ## 6 jerry 50 ## 7 god 48 ## 8 guys 48 ## 9 summer 45 ## 10 hey 44 ## # … with 3,046 more rows ``` ] --- count: false .panel1-sw7-auto[ ```r rickandmorty_filtered %>% * filter(n > 20) ``` ] .panel2-sw7-auto[ ``` ## # A tibble: 35 × 2 ## word n ## <chr> <int> ## 1 gonna 113 ## 2 time 89 ## 3 yeah 78 ## 4 uh 53 ## 5 whoa 53 ## 6 jerry 50 ## 7 god 48 ## 8 guys 48 ## 9 summer 45 ## 10 hey 44 ## # … with 25 more rows ``` ] --- count: false .panel1-sw7-auto[ ```r rickandmorty_filtered %>% filter(n > 20) %>% * mutate(word = reorder(word, n)) ``` ] .panel2-sw7-auto[ ``` ## # A tibble: 35 × 2 ## word n ## <fct> <int> ## 1 gonna 113 ## 2 time 89 ## 3 yeah 78 ## 4 uh 53 ## 5 whoa 53 ## 6 jerry 50 ## 7 god 48 ## 8 guys 48 ## 9 summer 45 ## 10 hey 44 ## # … with 25 more rows ``` ] --- count: false .panel1-sw7-auto[ ```r rickandmorty_filtered %>% filter(n > 20) %>% mutate(word = reorder(word, n)) %>% * ggplot(aes(n, word)) ``` ] .panel2-sw7-auto[ <!-- --> ] --- count: false .panel1-sw7-auto[ ```r rickandmorty_filtered %>% filter(n > 20) %>% mutate(word = reorder(word, n)) %>% ggplot(aes(n, word)) + * geom_col() ``` ] .panel2-sw7-auto[ <!-- --> ] --- count: false .panel1-sw7-auto[ ```r rickandmorty_filtered %>% filter(n > 20) %>% mutate(word = reorder(word, n)) %>% ggplot(aes(n, word)) + geom_col() + * labs(y = NULL) ``` ] .panel2-sw7-auto[ <!-- --> ] --- count: false .panel1-sw7-auto[ ```r rickandmorty_filtered %>% filter(n > 20) %>% mutate(word = reorder(word, n)) %>% ggplot(aes(n, word)) + geom_col() + labs(y = NULL) + * theme_minimal() ``` ] .panel2-sw7-auto[ <!-- --> ] <style> .panel1-sw7-auto { color: white; width: 58.8%; hight: 32%; float: left; padding-left: 1%; font-size: 80% } .panel2-sw7-auto { color: white; width: 39.2%; hight: 32%; float: left; padding-left: 1%; font-size: 80% } .panel3-sw7-auto { color: white; width: NA%; hight: 33%; float: left; padding-left: 1%; font-size: 80% } </style> --- # Sentiment Analysis -- + is used to determine whether a given text contains negative, positive, or neutral emotions -- + employs *Natural Language Processing* - computer program to understand human language as it is spoken and writte --- ## Bing Lexicon .center2[<i>General purpose English sentiment lexicon that categorizes words in a binary fashion, either positive or negative</i>] .footnote[[Opinion Mining, Sentiment Analysis, and Opinion Spam Detection](https://www.cs.uic.edu/~liub/FBS/sentiment-analysis.html)] --- count: false .panel1-sw8-auto[ ```r *rickandmorty_filtered ``` ] .panel2-sw8-auto[ ``` ## # A tibble: 3,056 × 2 ## word n ## <chr> <int> ## 1 gonna 113 ## 2 time 89 ## 3 yeah 78 ## 4 uh 53 ## 5 whoa 53 ## 6 jerry 50 ## 7 god 48 ## 8 guys 48 ## 9 summer 45 ## 10 hey 44 ## # … with 3,046 more rows ``` ] --- count: false .panel1-sw8-auto[ ```r rickandmorty_filtered %>% * rowid_to_column(var = "index") ``` ] .panel2-sw8-auto[ ``` ## # A tibble: 3,056 × 3 ## index word n ## <int> <chr> <int> ## 1 1 gonna 113 ## 2 2 time 89 ## 3 3 yeah 78 ## 4 4 uh 53 ## 5 5 whoa 53 ## 6 6 jerry 50 ## 7 7 god 48 ## 8 8 guys 48 ## 9 9 summer 45 ## 10 10 hey 44 ## # … with 3,046 more rows ``` ] --- count: false .panel1-sw8-auto[ ```r rickandmorty_filtered %>% rowid_to_column(var = "index") %>% * inner_join(get_sentiments("bing")) ``` ] .panel2-sw8-auto[ ``` ## Joining, by = "word" ``` ``` ## # A tibble: 486 × 4 ## index word n sentiment ## <int> <chr> <int> <chr> ## 1 5 whoa 53 positive ## 2 11 love 37 positive ## 3 17 shit 30 negative ## 4 20 hell 26 negative ## 5 22 bad 24 negative ## 6 30 die 22 negative ## 7 31 fuck 22 negative ## 8 43 crap 18 negative ## 9 45 pretty 18 positive ## 10 49 bitch 16 negative ## # … with 476 more rows ``` ] --- count: false .panel1-sw8-auto[ ```r rickandmorty_filtered %>% rowid_to_column(var = "index") %>% inner_join(get_sentiments("bing")) %>% * pivot_wider(names_from = sentiment, * values_from = n, * values_fill = 0) ``` ] .panel2-sw8-auto[ ``` ## Joining, by = "word" ``` ``` ## # A tibble: 486 × 4 ## index word positive negative ## <int> <chr> <int> <int> ## 1 5 whoa 53 0 ## 2 11 love 37 0 ## 3 17 shit 0 30 ## 4 20 hell 0 26 ## 5 22 bad 0 24 ## 6 30 die 0 22 ## 7 31 fuck 0 22 ## 8 43 crap 0 18 ## 9 45 pretty 18 0 ## 10 49 bitch 0 16 ## # … with 476 more rows ``` ] --- count: false .panel1-sw8-auto[ ```r rickandmorty_filtered %>% rowid_to_column(var = "index") %>% inner_join(get_sentiments("bing")) %>% pivot_wider(names_from = sentiment, values_from = n, values_fill = 0) %>% * mutate(sentiment = positive - negative) ``` ] .panel2-sw8-auto[ ``` ## Joining, by = "word" ``` ``` ## # A tibble: 486 × 5 ## index word positive negative sentiment ## <int> <chr> <int> <int> <int> ## 1 5 whoa 53 0 53 ## 2 11 love 37 0 37 ## 3 17 shit 0 30 -30 ## 4 20 hell 0 26 -26 ## 5 22 bad 0 24 -24 ## 6 30 die 0 22 -22 ## 7 31 fuck 0 22 -22 ## 8 43 crap 0 18 -18 ## 9 45 pretty 18 0 18 ## 10 49 bitch 0 16 -16 ## # … with 476 more rows ``` ] <style> .panel1-sw8-auto { color: white; width: 49%; hight: 32%; float: left; padding-left: 1%; font-size: 80% } .panel2-sw8-auto { color: white; width: 49%; hight: 32%; float: left; padding-left: 1%; font-size: 80% } .panel3-sw8-auto { color: white; width: NA%; hight: 33%; float: left; padding-left: 1%; font-size: 80% } </style> --- ```r rickandmorty_bing <- rickandmorty_filtered %>% rowid_to_column(var = "index") %>% inner_join(get_sentiments("bing")) %>% pivot_wider(names_from = sentiment, values_from = n, values_fill = 0) %>% mutate(sentiment = positive - negative) ``` ``` ## Joining, by = "word" ``` --- count: false .panel1-sw9-auto[ ```r *ggplot(rickandmorty_bing, * aes(index, sentiment)) ``` ] .panel2-sw9-auto[ <!-- --> ] --- count: false .panel1-sw9-auto[ ```r ggplot(rickandmorty_bing, aes(index, sentiment)) + * geom_bar(stat = "identity", * show.legend = FALSE) ``` ] .panel2-sw9-auto[ <!-- --> ] --- count: false .panel1-sw9-auto[ ```r ggplot(rickandmorty_bing, aes(index, sentiment)) + geom_bar(stat = "identity", show.legend = FALSE) + * theme_minimal() ``` ] .panel2-sw9-auto[ <!-- --> ] --- count: false .panel1-sw9-auto[ ```r ggplot(rickandmorty_bing, aes(index, sentiment)) + geom_bar(stat = "identity", show.legend = FALSE) + theme_minimal() + * facet_wrap(~sentiment, scales = "free_y") ``` ] .panel2-sw9-auto[ <!-- --> ] <style> .panel1-sw9-auto { color: white; width: 58.8%; hight: 32%; float: left; padding-left: 1%; font-size: 80% } .panel2-sw9-auto { color: white; width: 39.2%; hight: 32%; float: left; padding-left: 1%; font-size: 80% } .panel3-sw9-auto { color: white; width: NA%; hight: 33%; float: left; padding-left: 1%; font-size: 80% } </style> --- ## AFINN Lexicon .center2[<i>Lexicon of English words rated for valence with an integer between minus five (negative) and plus five (positive)</i>] .footnote[[afinn project](https://github.com/fnielsen/afinn)] --- count: false .panel1-sw10-auto[ ```r *rickandmorty_filtered ``` ] .panel2-sw10-auto[ ``` ## # A tibble: 3,056 × 2 ## word n ## <chr> <int> ## 1 gonna 113 ## 2 time 89 ## 3 yeah 78 ## 4 uh 53 ## 5 whoa 53 ## 6 jerry 50 ## 7 god 48 ## 8 guys 48 ## 9 summer 45 ## 10 hey 44 ## # … with 3,046 more rows ``` ] --- count: false .panel1-sw10-auto[ ```r rickandmorty_filtered %>% * rowid_to_column(var = "index") ``` ] .panel2-sw10-auto[ ``` ## # A tibble: 3,056 × 3 ## index word n ## <int> <chr> <int> ## 1 1 gonna 113 ## 2 2 time 89 ## 3 3 yeah 78 ## 4 4 uh 53 ## 5 5 whoa 53 ## 6 6 jerry 50 ## 7 7 god 48 ## 8 8 guys 48 ## 9 9 summer 45 ## 10 10 hey 44 ## # … with 3,046 more rows ``` ] --- count: false .panel1-sw10-auto[ ```r rickandmorty_filtered %>% rowid_to_column(var = "index") %>% * inner_join(get_sentiments("afinn")) ``` ] .panel2-sw10-auto[ ``` ## Joining, by = "word" ``` ``` ## # A tibble: 420 × 4 ## index word n value ## <int> <chr> <int> <dbl> ## 1 3 yeah 78 1 ## 2 7 god 48 1 ## 3 11 love 37 3 ## 4 17 shit 30 -4 ## 5 20 hell 26 -4 ## 6 22 bad 24 -3 ## 7 28 stop 23 -1 ## 8 30 die 22 -3 ## 9 31 fuck 22 -4 ## 10 43 crap 18 -3 ## # … with 410 more rows ``` ] <style> .panel1-sw10-auto { color: white; width: 58.8%; hight: 32%; float: left; padding-left: 1%; font-size: 80% } .panel2-sw10-auto { color: white; width: 39.2%; hight: 32%; float: left; padding-left: 1%; font-size: 80% } .panel3-sw10-auto { color: white; width: NA%; hight: 33%; float: left; padding-left: 1%; font-size: 80% } </style> --- ```r rickandmorty_afinn <- rickandmorty_filtered %>% rowid_to_column(var = "index") %>% inner_join(get_sentiments("afinn")) ``` ``` ## Joining, by = "word" ``` --- count: false .panel1-sw11-auto[ ```r *ggplot(rickandmorty_afinn, * aes(index, value)) ``` ] .panel2-sw11-auto[ <!-- --> ] --- count: false .panel1-sw11-auto[ ```r ggplot(rickandmorty_afinn, aes(index, value)) + * geom_bar(stat = "identity", * show.legend = FALSE) ``` ] .panel2-sw11-auto[ <!-- --> ] --- count: false .panel1-sw11-auto[ ```r ggplot(rickandmorty_afinn, aes(index, value)) + geom_bar(stat = "identity", show.legend = FALSE) + * theme_minimal() ``` ] .panel2-sw11-auto[ <!-- --> ] --- count: false .panel1-sw11-auto[ ```r ggplot(rickandmorty_afinn, aes(index, value)) + geom_bar(stat = "identity", show.legend = FALSE) + theme_minimal() + * facet_wrap(~value, scales = "free_y") ``` ] .panel2-sw11-auto[ <!-- --> ] <style> .panel1-sw11-auto { color: white; width: 58.8%; hight: 32%; float: left; padding-left: 1%; font-size: 80% } .panel2-sw11-auto { color: white; width: 39.2%; hight: 32%; float: left; padding-left: 1%; font-size: 80% } .panel3-sw11-auto { color: white; width: NA%; hight: 33%; float: left; padding-left: 1%; font-size: 80% } </style> --- count: false .panel1-sw12-auto[ ```r *rickandmorty_filtered ``` ] .panel2-sw12-auto[ ``` ## # A tibble: 3,056 × 2 ## word n ## <chr> <int> ## 1 gonna 113 ## 2 time 89 ## 3 yeah 78 ## 4 uh 53 ## 5 whoa 53 ## 6 jerry 50 ## 7 god 48 ## 8 guys 48 ## 9 summer 45 ## 10 hey 44 ## # … with 3,046 more rows ``` ] --- count: false .panel1-sw12-auto[ ```r rickandmorty_filtered %>% * rowid_to_column(var = "index") ``` ] .panel2-sw12-auto[ ``` ## # A tibble: 3,056 × 3 ## index word n ## <int> <chr> <int> ## 1 1 gonna 113 ## 2 2 time 89 ## 3 3 yeah 78 ## 4 4 uh 53 ## 5 5 whoa 53 ## 6 6 jerry 50 ## 7 7 god 48 ## 8 8 guys 48 ## 9 9 summer 45 ## 10 10 hey 44 ## # … with 3,046 more rows ``` ] --- count: false .panel1-sw12-auto[ ```r rickandmorty_filtered %>% rowid_to_column(var = "index") %>% * inner_join(get_sentiments("afinn")) ``` ] .panel2-sw12-auto[ ``` ## Joining, by = "word" ``` ``` ## # A tibble: 420 × 4 ## index word n value ## <int> <chr> <int> <dbl> ## 1 3 yeah 78 1 ## 2 7 god 48 1 ## 3 11 love 37 3 ## 4 17 shit 30 -4 ## 5 20 hell 26 -4 ## 6 22 bad 24 -3 ## 7 28 stop 23 -1 ## 8 30 die 22 -3 ## 9 31 fuck 22 -4 ## 10 43 crap 18 -3 ## # … with 410 more rows ``` ] --- count: false .panel1-sw12-auto[ ```r rickandmorty_filtered %>% rowid_to_column(var = "index") %>% inner_join(get_sentiments("afinn")) %>% * mutate(sentiment = if_else(value > 0, * "positive", * "negative", * "NA")) ``` ] .panel2-sw12-auto[ ``` ## Joining, by = "word" ``` ``` ## # A tibble: 420 × 5 ## index word n value sentiment ## <int> <chr> <int> <dbl> <chr> ## 1 3 yeah 78 1 positive ## 2 7 god 48 1 positive ## 3 11 love 37 3 positive ## 4 17 shit 30 -4 negative ## 5 20 hell 26 -4 negative ## 6 22 bad 24 -3 negative ## 7 28 stop 23 -1 negative ## 8 30 die 22 -3 negative ## 9 31 fuck 22 -4 negative ## 10 43 crap 18 -3 negative ## # … with 410 more rows ``` ] <style> .panel1-sw12-auto { color: white; width: 58.8%; hight: 32%; float: left; padding-left: 1%; font-size: 80% } .panel2-sw12-auto { color: white; width: 39.2%; hight: 32%; float: left; padding-left: 1%; font-size: 80% } .panel3-sw12-auto { color: white; width: NA%; hight: 33%; float: left; padding-left: 1%; font-size: 80% } </style> --- ```r rickandmorty_afinn_posneg <- rickandmorty_filtered %>% rowid_to_column(var = "index") %>% inner_join(get_sentiments("afinn")) %>% mutate(sentiment = if_else(value > 0, "positive", "negative", "NA")) ``` ``` ## Joining, by = "word" ``` --- count: false .panel1-sw13-auto[ ```r *ggplot(rickandmorty_afinn_posneg, * aes(index, value, fill = sentiment)) ``` ] .panel2-sw13-auto[ <!-- --> ] --- count: false .panel1-sw13-auto[ ```r ggplot(rickandmorty_afinn_posneg, aes(index, value, fill = sentiment)) + * geom_bar(stat = "identity", * show.legend = FALSE) ``` ] .panel2-sw13-auto[ 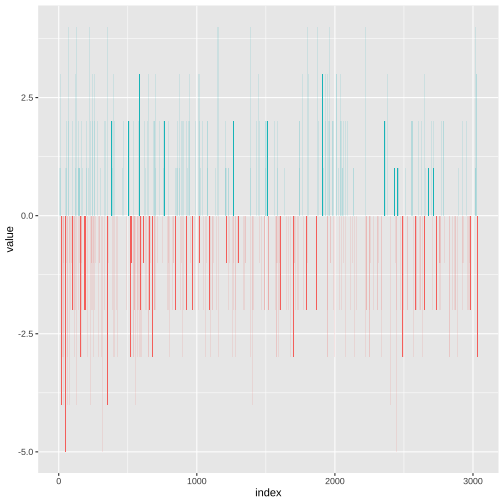<!-- --> ] --- count: false .panel1-sw13-auto[ ```r ggplot(rickandmorty_afinn_posneg, aes(index, value, fill = sentiment)) + geom_bar(stat = "identity", show.legend = FALSE) + * theme_minimal() ``` ] .panel2-sw13-auto[ 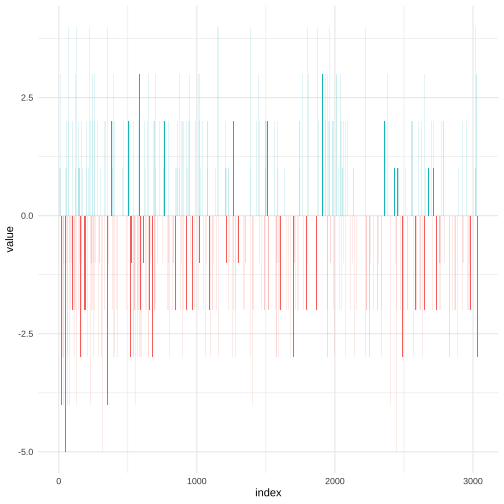<!-- --> ] <style> .panel1-sw13-auto { color: white; width: 58.8%; hight: 32%; float: left; padding-left: 1%; font-size: 80% } .panel2-sw13-auto { color: white; width: 39.2%; hight: 32%; float: left; padding-left: 1%; font-size: 80% } .panel3-sw13-auto { color: white; width: NA%; hight: 33%; float: left; padding-left: 1%; font-size: 80% } </style> --- count: false .panel1-sw14-auto[ ```r *ggplot(rickandmorty_afinn_posneg, * aes(index, value, fill = sentiment)) ``` ] .panel2-sw14-auto[ <!-- --> ] --- count: false .panel1-sw14-auto[ ```r ggplot(rickandmorty_afinn_posneg, aes(index, value, fill = sentiment)) + * geom_bar(stat = "identity", * show.legend = FALSE) ``` ] .panel2-sw14-auto[ 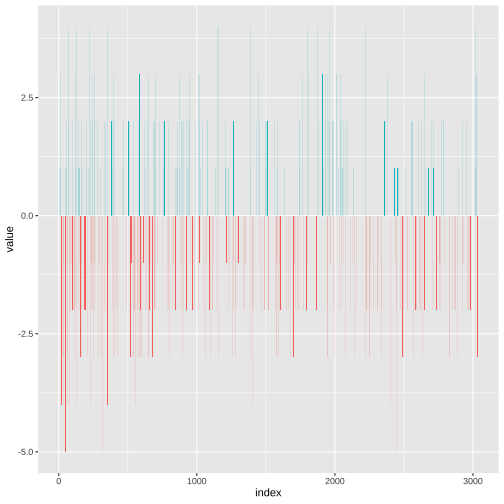<!-- --> ] --- count: false .panel1-sw14-auto[ ```r ggplot(rickandmorty_afinn_posneg, aes(index, value, fill = sentiment)) + geom_bar(stat = "identity", show.legend = FALSE) + * theme_minimal() ``` ] .panel2-sw14-auto[ <!-- --> ] --- count: false .panel1-sw14-auto[ ```r ggplot(rickandmorty_afinn_posneg, aes(index, value, fill = sentiment)) + geom_bar(stat = "identity", show.legend = FALSE) + theme_minimal() + * scale_fill_manual(values = c("lightsalmon", "khaki")) ``` ] .panel2-sw14-auto[ <!-- --> ] <style> .panel1-sw14-auto { color: white; width: 58.8%; hight: 32%; float: left; padding-left: 1%; font-size: 80% } .panel2-sw14-auto { color: white; width: 39.2%; hight: 32%; float: left; padding-left: 1%; font-size: 80% } .panel3-sw14-auto { color: white; width: NA%; hight: 33%; float: left; padding-left: 1%; font-size: 80% } </style> .footnote[[Colors in R](http://www.stat.columbia.edu/~tzheng/files/Rcolor.pdf)] --- count: false .panel1-sw15-auto[ ```r *ggplot(rickandmorty_afinn_posneg, * aes(index, value, fill = sentiment)) ``` ] .panel2-sw15-auto[ <!-- --> ] --- count: false .panel1-sw15-auto[ ```r ggplot(rickandmorty_afinn_posneg, aes(index, value, fill = sentiment)) + * geom_bar(stat = "identity", * show.legend = FALSE) ``` ] .panel2-sw15-auto[ <!-- --> ] --- count: false .panel1-sw15-auto[ ```r ggplot(rickandmorty_afinn_posneg, aes(index, value, fill = sentiment)) + geom_bar(stat = "identity", show.legend = FALSE) + * theme_minimal() ``` ] .panel2-sw15-auto[ <!-- --> ] --- count: false .panel1-sw15-auto[ ```r ggplot(rickandmorty_afinn_posneg, aes(index, value, fill = sentiment)) + geom_bar(stat = "identity", show.legend = FALSE) + theme_minimal() + * scale_fill_manual(values = c("#ffb3ba", "#bae1ff")) ``` ] .panel2-sw15-auto[ <!-- --> ] <style> .panel1-sw15-auto { color: white; width: 58.8%; hight: 32%; float: left; padding-left: 1%; font-size: 80% } .panel2-sw15-auto { color: white; width: 39.2%; hight: 32%; float: left; padding-left: 1%; font-size: 80% } .panel3-sw15-auto { color: white; width: NA%; hight: 33%; float: left; padding-left: 1%; font-size: 80% } </style> .footnote[[Color Hex Color Codes](https://www.color-hex.com/)] --- ## NRC Lexicon .center2[<i>Lexicon labels words with six possible sentiments or emotions: "negative", "positive", "anger", "anticipation", "disgust", "fear", "joy", "sadness", "surprise", or "trust".</i>] .footnote[[NRC Word-Emotion Association Lexicon](https://saifmohammad.com/WebPages/NRC-Emotion-Lexicon.htm)] --- count: false .panel1-sw16-auto[ ```r *rickandmorty_filtered ``` ] .panel2-sw16-auto[ ``` ## # A tibble: 3,056 × 2 ## word n ## <chr> <int> ## 1 gonna 113 ## 2 time 89 ## 3 yeah 78 ## 4 uh 53 ## 5 whoa 53 ## 6 jerry 50 ## 7 god 48 ## 8 guys 48 ## 9 summer 45 ## 10 hey 44 ## # … with 3,046 more rows ``` ] --- count: false .panel1-sw16-auto[ ```r rickandmorty_filtered %>% * rowid_to_column(var = "index") ``` ] .panel2-sw16-auto[ ``` ## # A tibble: 3,056 × 3 ## index word n ## <int> <chr> <int> ## 1 1 gonna 113 ## 2 2 time 89 ## 3 3 yeah 78 ## 4 4 uh 53 ## 5 5 whoa 53 ## 6 6 jerry 50 ## 7 7 god 48 ## 8 8 guys 48 ## 9 9 summer 45 ## 10 10 hey 44 ## # … with 3,046 more rows ``` ] --- count: false .panel1-sw16-auto[ ```r rickandmorty_filtered %>% rowid_to_column(var = "index") %>% * inner_join(get_sentiments("nrc")) ``` ] .panel2-sw16-auto[ ``` ## Joining, by = "word" ``` ``` ## # A tibble: 1,707 × 4 ## index word n sentiment ## <int> <chr> <int> <chr> ## 1 2 time 89 anticipation ## 2 7 god 48 anticipation ## 3 7 god 48 fear ## 4 7 god 48 joy ## 5 7 god 48 positive ## 6 7 god 48 trust ## 7 11 love 37 joy ## 8 11 love 37 positive ## 9 17 shit 30 anger ## 10 17 shit 30 disgust ## # … with 1,697 more rows ``` ] <style> .panel1-sw16-auto { color: white; width: 58.8%; hight: 32%; float: left; padding-left: 1%; font-size: 80% } .panel2-sw16-auto { color: white; width: 39.2%; hight: 32%; float: left; padding-left: 1%; font-size: 80% } .panel3-sw16-auto { color: white; width: NA%; hight: 33%; float: left; padding-left: 1%; font-size: 80% } </style> --- ```r rickandmorty_nrc <- rickandmorty_filtered %>% rowid_to_column(var = "index") %>% inner_join(get_sentiments("nrc")) ``` ``` ## Joining, by = "word" ``` --- count: false .panel1-sw17-auto[ ```r *ggplot(rickandmorty_nrc, * aes(index, sentiment, * fill = sentiment)) ``` ] .panel2-sw17-auto[ <!-- --> ] --- count: false .panel1-sw17-auto[ ```r ggplot(rickandmorty_nrc, aes(index, sentiment, fill = sentiment)) + * geom_bar(stat = "identity", * show.legend = FALSE) ``` ] .panel2-sw17-auto[ <!-- --> ] --- count: false .panel1-sw17-auto[ ```r ggplot(rickandmorty_nrc, aes(index, sentiment, fill = sentiment)) + geom_bar(stat = "identity", show.legend = FALSE) + * theme_minimal() ``` ] .panel2-sw17-auto[ <!-- --> ] --- count: false .panel1-sw17-auto[ ```r ggplot(rickandmorty_nrc, aes(index, sentiment, fill = sentiment)) + geom_bar(stat = "identity", show.legend = FALSE) + theme_minimal() + * facet_wrap(~sentiment, scales = "free_y", * nrow = 5, ncol = 2) ``` ] .panel2-sw17-auto[ <!-- --> ] --- count: false .panel1-sw17-auto[ ```r ggplot(rickandmorty_nrc, aes(index, sentiment, fill = sentiment)) + geom_bar(stat = "identity", show.legend = FALSE) + theme_minimal() + facet_wrap(~sentiment, scales = "free_y", nrow = 5, ncol = 2) + * scale_fill_manual(values = c("#05A4C0", "#85CEDA", * "#D2A7D8", "#A67BC5", * "#BB1C8B", "#8D266E", * "#BE82AF", "#9D4387", * "#DEC0D7", "#40BDC8", * "#80D3DB", "#BFE9ED")) ``` ] .panel2-sw17-auto[ <!-- --> ] --- count: false .panel1-sw17-auto[ ```r ggplot(rickandmorty_nrc, aes(index, sentiment, fill = sentiment)) + geom_bar(stat = "identity", show.legend = FALSE) + theme_minimal() + facet_wrap(~sentiment, scales = "free_y", nrow = 5, ncol = 2) + scale_fill_manual(values = c("#05A4C0", "#85CEDA", "#D2A7D8", "#A67BC5", "#BB1C8B", "#8D266E", "#BE82AF", "#9D4387", "#DEC0D7", "#40BDC8", "#80D3DB", "#BFE9ED")) ``` ] .panel2-sw17-auto[ <!-- --> ] <style> .panel1-sw17-auto { color: white; width: 58.8%; hight: 32%; float: left; padding-left: 1%; font-size: 80% } .panel2-sw17-auto { color: white; width: 39.2%; hight: 32%; float: left; padding-left: 1%; font-size: 80% } .panel3-sw17-auto { color: white; width: NA%; hight: 33%; float: left; padding-left: 1%; font-size: 80% } </style> --- # That’s It! Any questions? -- <br> <br> <br> <br> <br> <br> <br> <br> <center> <br><br> <div class="fade_rule"></div> <br><br> </center> <center> <a rel="license" href="http://creativecommons.org/licenses/by-nc-sa/4.0/"><img alt="Creative Commons License" style="border-width:0" src="https://i.creativecommons.org/l/by-nc-sa/4.0/88x31.png" /></a><br /><br />This work is licensed under a <br /><a rel="license" href="http://creativecommons.org/licenses/by-nc-sa/4.0/">Creative Commons Attribution-NonCommercial-ShareAlike 4.0 International License</a> </center>